Performance Measures Report 2021
Burlington Electric Department (BED) presents an annual Performance Measures Report (PMR) to provide information about our work for the benefit of our customers and the community. The PMR shows key metrics for customer care, safety, reliability and generation, renewable energy, rates and bills, energy efficiency, and Net Zero Energy. For more information on BED’s work in 2021 please see the City’s Annual Report for 2021 (pp. 35-39).
Supporting our Customers and Community
2021 continued to bring unexpected challenges for Burlington and BED’s customers. BED prioritized supporting our customers, employees, and community in response to the COVID-19 pandemic, while continuing to make progress on our Net Zero Energy city goal. BED suspended disconnections for non-payment, late fees, and interest. We provided new payment plan options to help customers who were behind on their bills and partnered with the Department of Public Service to deliver utility bill assistance to hundreds of our customers. We continue to encourage Burlingtonians impacted by the pandemic to take advantage of BED and State of Vermont assistance programs listed on our home page. Our Customer Care team is always ready to help and can be contacted at 802.865.7300 or online.
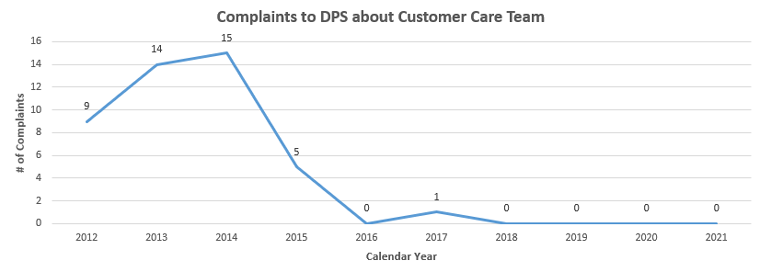
Our efforts, for our fourth consecutive year, have served our customers without a single escalation to the Department of Public Service (DPS).
Continuing our Progress on Net Zero Energy
2030 Vision: Make Burlington a Net Zero Energy city by eliminating fossil fuel usage across electric, thermal, and ground transportation sectors, strategically electrifying, managing demand, realizing efficiency gains, and expanding local renewable generation while increasing system resilience.
Key Takeaways from the 2021 Roadmap Update
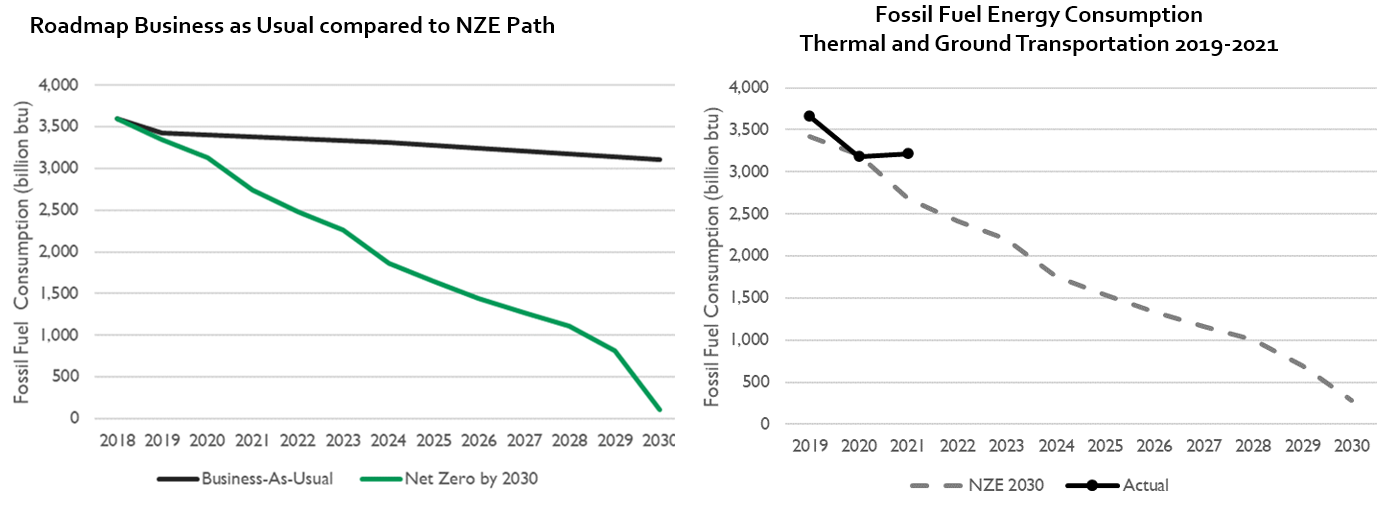
- Fossil Fuel Use and Greenhouse Gas Emissions in Burlington experienced a mild rebound compared to pandemic-impacted 2020. Burlington emissions were up about 1.5% in 2021 compared to 2020. Nationally, emissions up 6.2% in 2021, compared to 2020.
- However, Burlington emissions were still down 12.5% (188 thousand metric tons) in 2021 compared to 2018 levels (215 thousand metric tons).
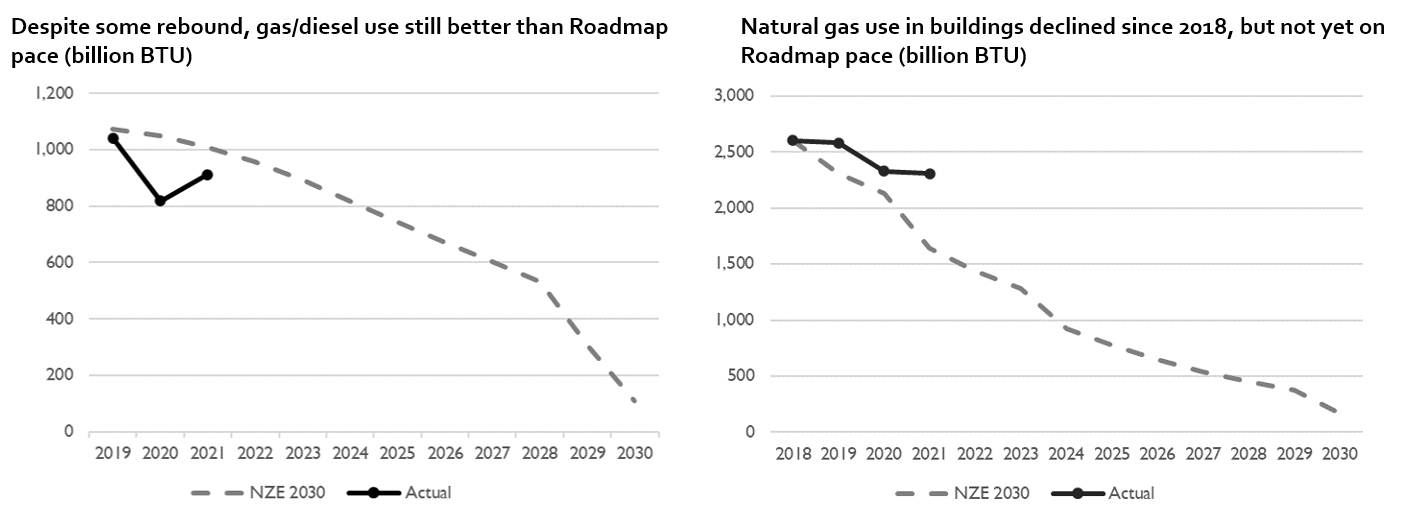
- Natural gas use in 2021 in Burlington was down approximately 1% from 2020 levels (not weather normalized); gasoline and diesel consumption for transportation was up approximately 10% from 2020.
- In 2021 vehicle miles traveled partially rebounded to estimated 7,565 per vehicle, up from 6,671 in 2020. 2018 baseline was 8,187.
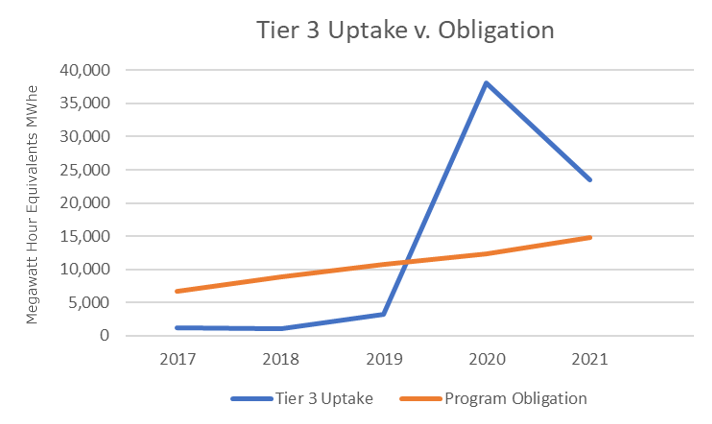
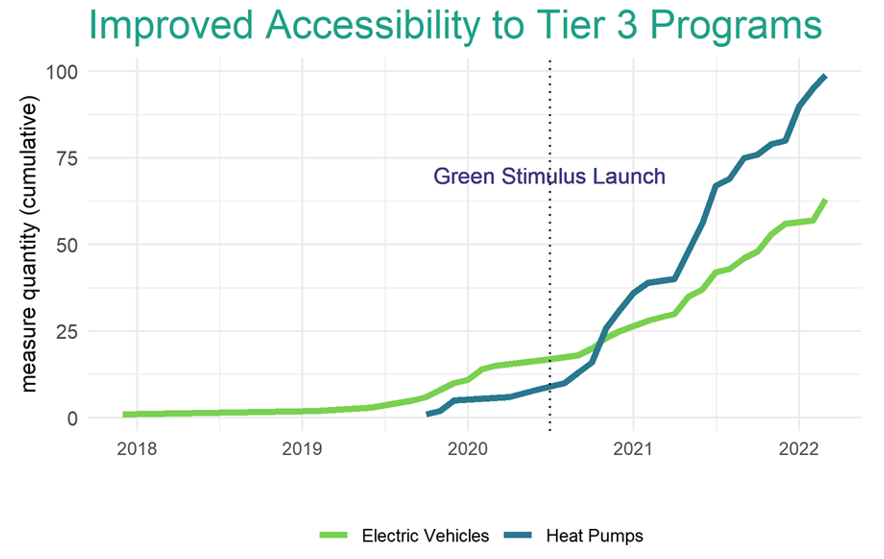
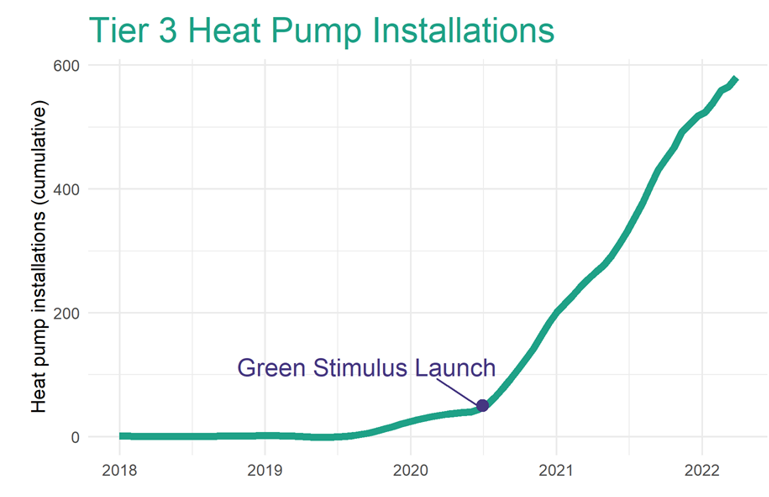
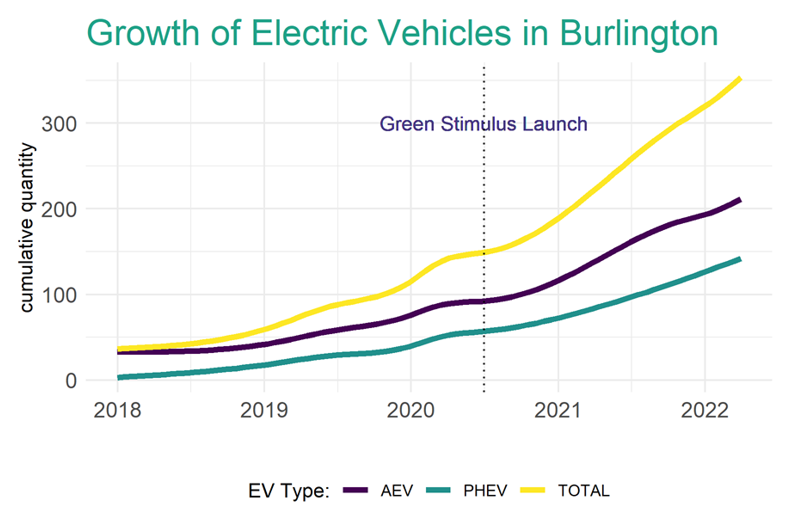
- While we have made significant progress on strategic electrification, not yet on pace for the Roadmap goals for heat pumps and EVs.
- Recent initiatives – weatherization in rental properties, new construction renewable heating, NZE Revenue Bond – not yet impacting data, but will starting in 2022.
- Relative to national trends, Burlington did better in mitigating emissions rebound coming out of pandemic and made progress on many fronts in 2021. Additional strong actions are needed to keep NZE goals within reach.

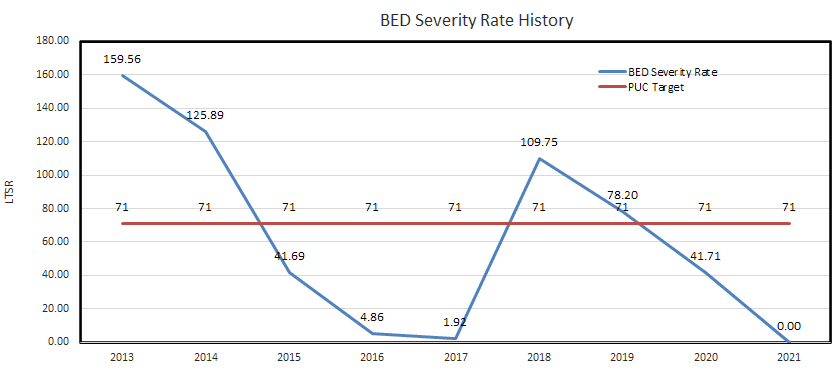
Safety
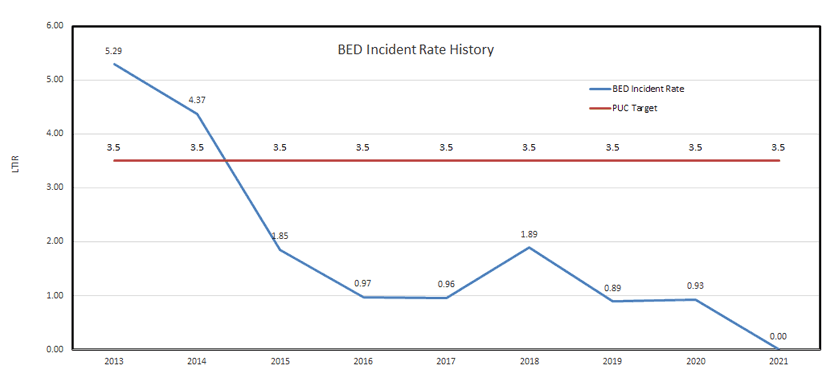
At BED, safety is our number one value.
Reliability and Generation
| 2016 | 2017 | 2018 | 2019 | 2020 | 2021 | |
|---|---|---|---|---|---|---|
| Average # customer interruptions target: 2.10 |
0.6 | 0.7 | 0.4 | 1.02 | 1.5 | 0.17 |
| Average hours of interruptions target: 1.20 |
1.0 | 0.9 | 0.9 | 0.75 | 0.55 | 1.49 |
| McNeil Generating Station | 2019 | 2020 | 2021 |
|---|---|---|---|
| MWH generated | 227,247 | 229,725 | 270,338 |
| Availability factor | 72% | 74.8% | 79.7% |
| Capacity factor | 51.8% | 52.3% | 61.7% |
| Winooski One Hydro | 2019 | 2020 | 2021 |
|---|---|---|---|
| MWH generated | 33,247 | 24,934 | 24,753 |
| Availability factor | 96% | 91.5% | 97% |
| Capacity factor | 51% | 37.3% | 38.1% |
Renewable Energy
Note: Charts showing data for 2021 will be available by the end of June 2022.
In 2014, Burlington become the first city in the nation to source 100 percent of its power from renewable generation. Below is BED’s 2020 energy supply pre-renewable energy credit (REC) sales and post-REC sales and purchases.
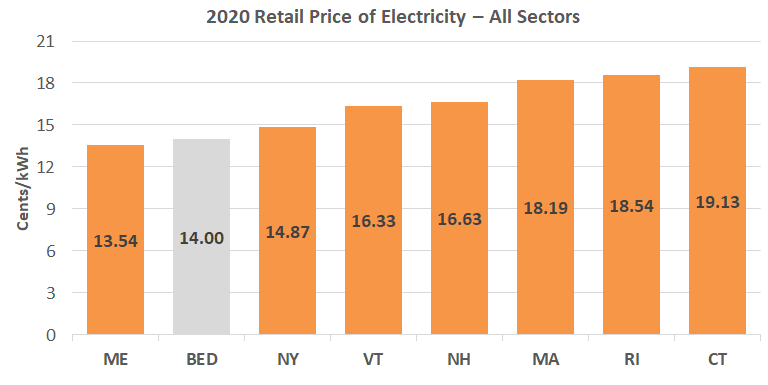
BED’s power supply reflects several considerations including cost, renewability, predictability, reliability, diversity, and other economic and environmental impacts. While cost is always critical, other factors influence purchase decisions. BED has succeeded in maintaining comparatively low and stable rates, while continuing our commitment to renewables and, to the extent possible, keeping money in Vermont by supporting Vermont-based renewable generation.
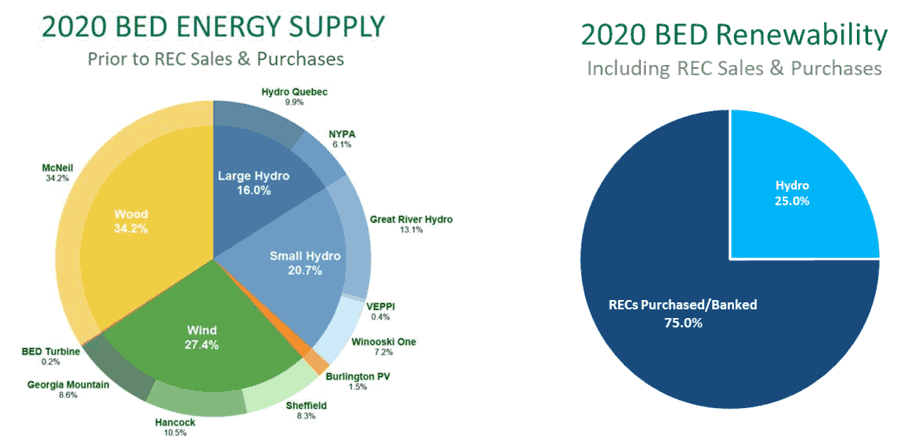 Note: BED’s energy purchases exceeded customer needs in 2020 by 8%. As a result, the chart on the left reflects percentage of total purchases, not sales to customers.
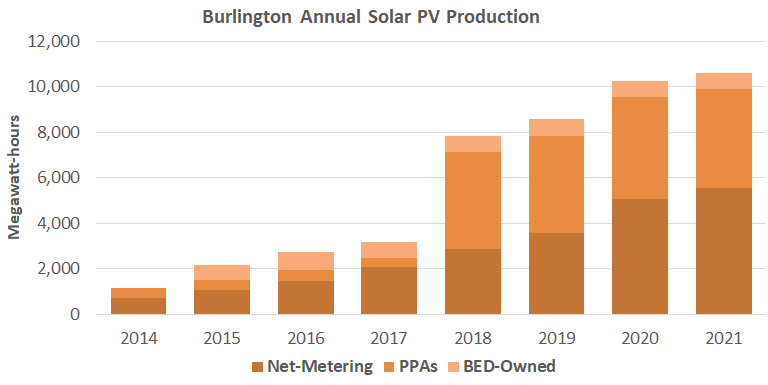
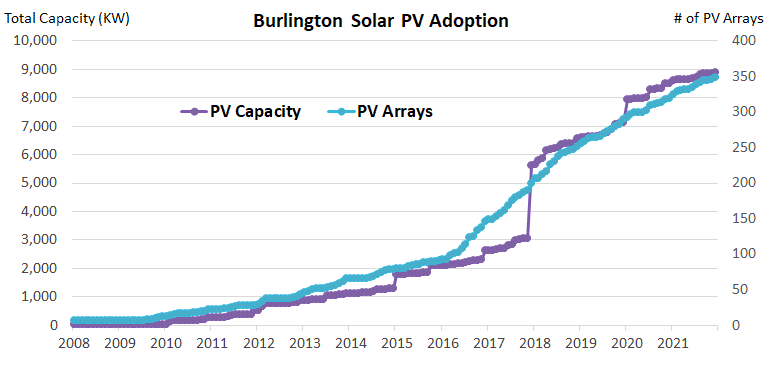
Solar Development
Burlington was the leading solar city in the northeast region for per capita solar capacity according to the Shining Cities 2020 Environment America report.
Source: Burlington Electric Department
 Source: Burlington Electric Department
Rates and Bills
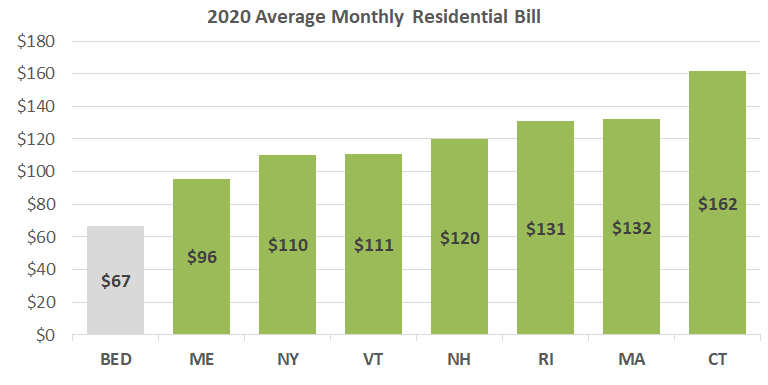
BED provides electric service to 21,490 customers (approximately 80 percent residential, 20 percent commercial/industrial). Commercial and industrial customers use much more electricity than residential customers, accounting for approximately 70 percent of electricity sales.
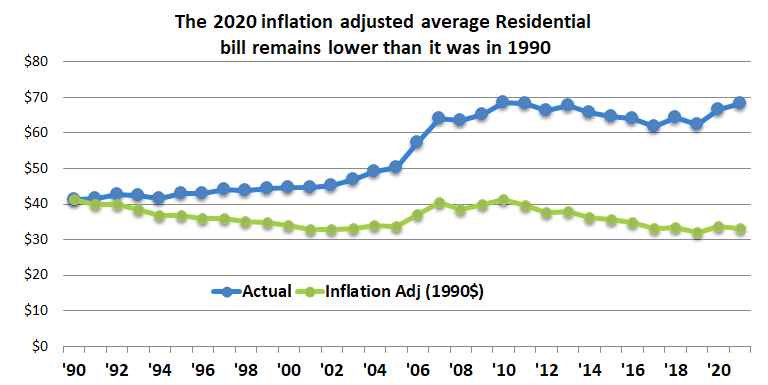
For fiscal year 2023 (beginning July 1, 2022), BED is proposing a 3.95 percent rate increase, scheduled to take effect as a bill surcharge in August 2022. The figures below reflect BED rates and bill data prior to the rate case. Customers interested in learning more about the rate case and/or in applying for our temporary energy assistance program are invited to visit our rates page.
Source: Energy Information Administration
Source: Burlington Electric Department
Source: Energy Information Administration
Energy Efficiency
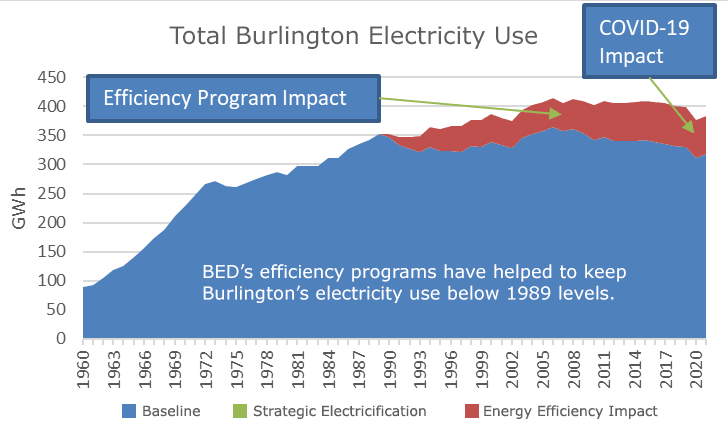
BED is an Energy Efficiency Utility (EEU) appointed by the Public Utility Commission. As of year-end 2021, electricity consumption in Burlington is approximately 8 percent lower than in 1989 (adjusted to remove COVID-19 impacts – actual electric consumption in 2020 was 12 percent lower than in 1989, when including COVID-19 impacts). From 1989-2018, statewide electric consumption increased more than 10 percent. Over same period, U.S. consumption increased more than 30 percent. BED and our customers have invested over $72 million, including an $11.3 million bond for efficiency in 1990. Energy efficiency investments in Burlington are saving our customers approximately $10.4 million annually on electric bills, including avoided energy and transmission and capacity costs. Through Green Stimulus, our BED efficiency program now covers 100 percent of eligible energy efficiency upgrades for affordable housing providers, and pre-approved weatherization projects now receive up to 75 percent incentive.
Given our Net Zero Energy goal and strategic electrification efforts, however, we need to evaluate electricity use in a new light. Converting certain fossil fuel uses for transportation and heating to electricity represents a more efficient use of energy, but a higher use of electricity in exchange for the reduced fossil fuel consumption. To realize Burlington’s Net Zero Energy city goal, electricity use by the transportation and heating sectors is expected to rise significantly. Accordingly, the graph below now includes the portion of BED’s sales that result from these activities as a separate category so their impacts (and their benefits) can be understood. While early impacts of strategic electrification are small compared to BED’s existing total sales, we anticipate the impact of these programs will show up in higher sales to customers over time as we reduce fossil fuel use and increase the use of renewable electricity.
BED’s efficiency programs have helped to keep Burlington’s electricity usage below 1989 levels.
Board of Electric Commissioners
Gabrielle Stebbins, Chair | Scott Moody, Vice Chair | Jim Chagnon | Robert Herendeen | Bethany Whitaker
Visit the Board of Electric Commissioners page.
Past Performance Measures Reports
- 2020 Performance Measures Report
- 2019 Performance Measures Report
- 2018 Performance Measures Report
- 2017 Performance Measures Report
- 2016 Performance Measures Report
- 2015 Performance Measures Report
- 2014 Performance Measures Report
- 2013 Performance Measures Report
- 2012 Performance Measures Report
- 2011 Performance Measures Report
- 2010 Performance Measures Report
- 2009 Performance Measures Report
